Overview
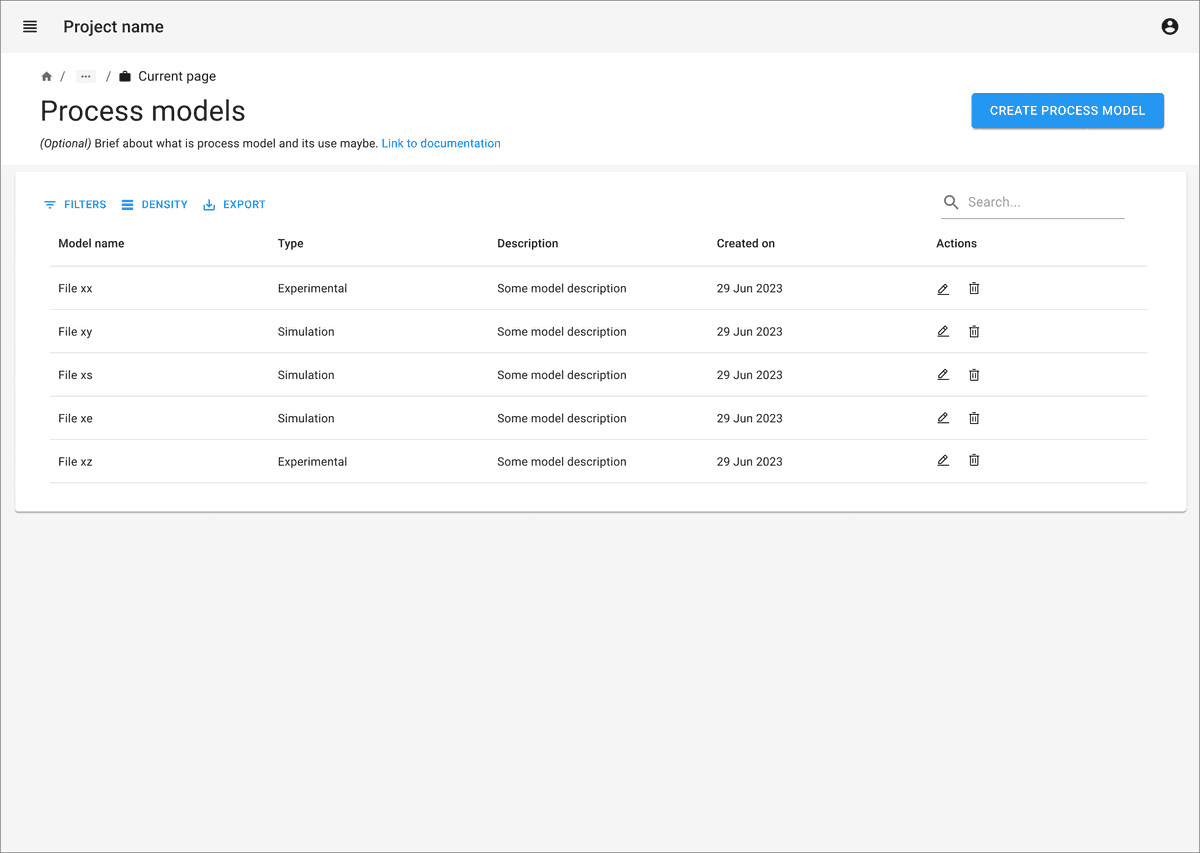
Guidelines for adapting the Task Flow
Determine and group the different inputs needed to creating a new process graph/ model
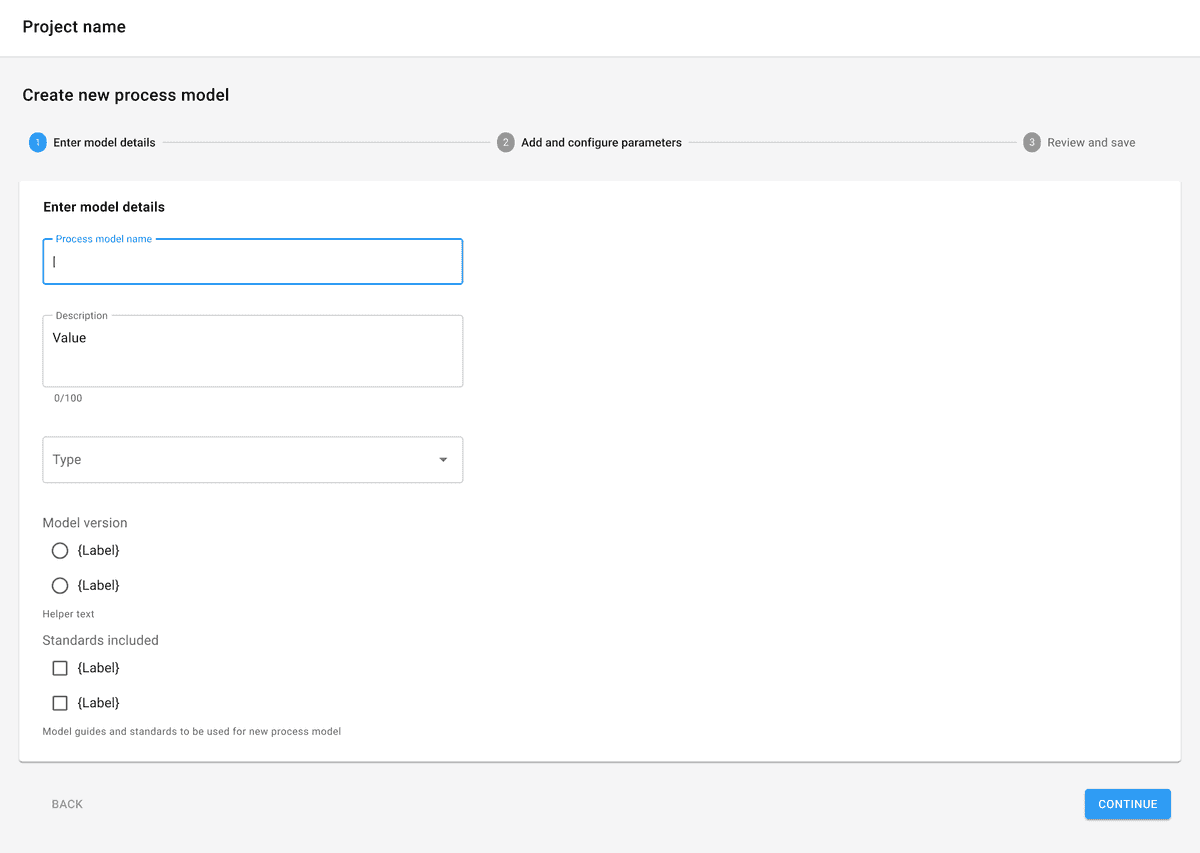
Start with the primary details needed to identify the process model
If there is a long list of primary details for inputs, break it down into smaller sections with a left navigation panel
Consider pre-setting inputs to defaults wherever possible
Give progress indicator to show users where they are at the creation process
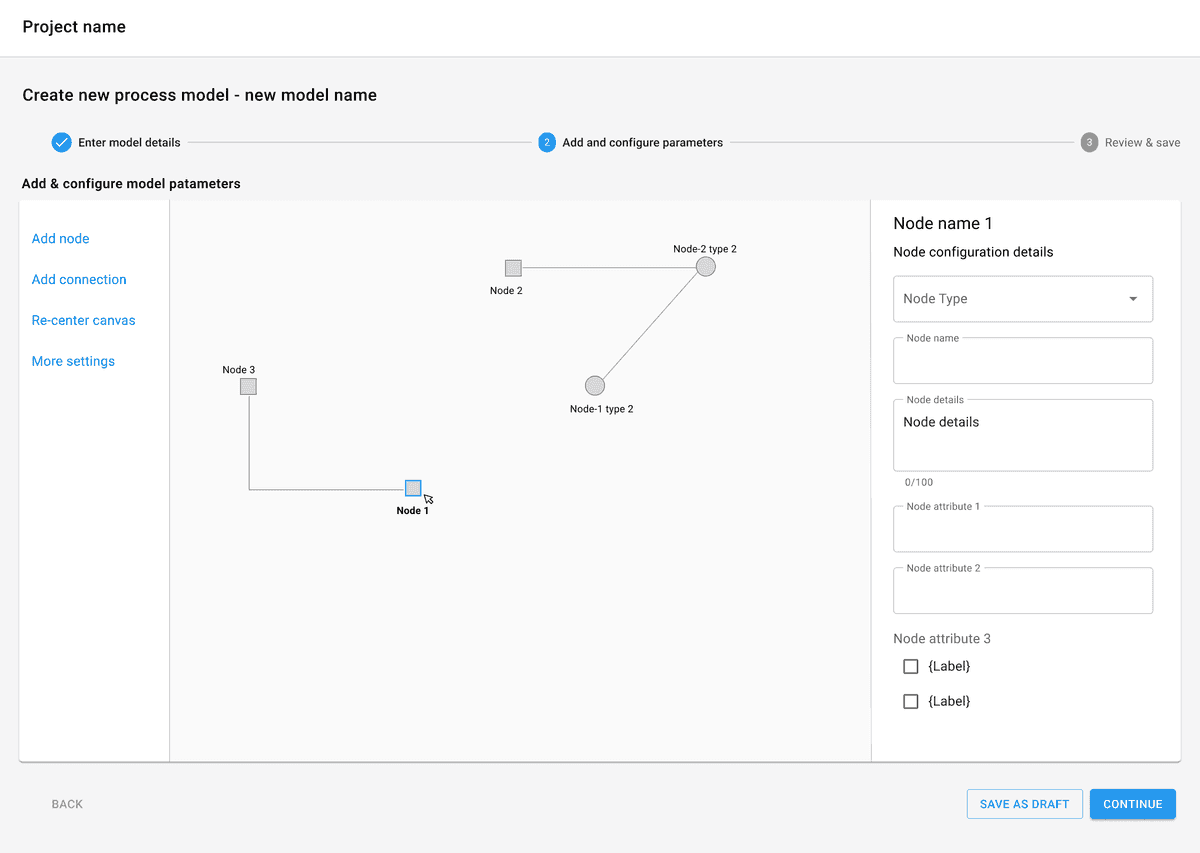
The process model often requires a canvas interaction for model elements. Give the controls to add model elements in the left panel while the details of the elements can be set in a right panel
Since this can be a time consuming task-flow, give users a way to save the current progress as a draft version
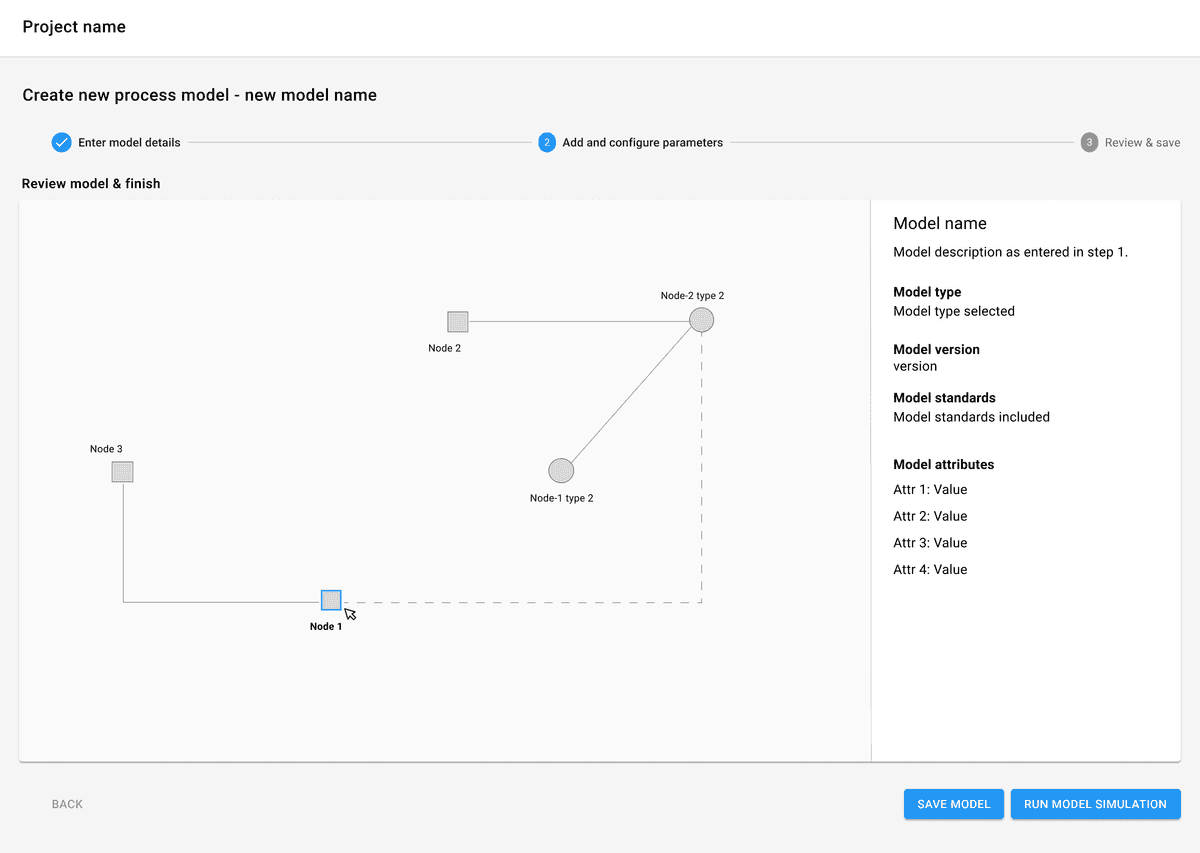
Before final save, let users review all the model information they have configured
After configuring the model, the next steps could be running a simulation or calculation on the model. Consider showing the next steps to users to ease their work flows.

