Content from What is Rapid Usability Testing?
Last updated on 2025-07-25 | Edit this page
Overview
Questions
- What is usability?
- What is user experience research (UXR)?
- How can UXR help solve usability problems in scientific software?
- What is rapid usability testing?
- Under what circumstances should you conduct a rapid usability test?
Objectives
- Define user experience research
- Recognize key characteristics of rapid usability testing
- Identify scenarios and tasks appropriate for rapid usability testing
What is usability?
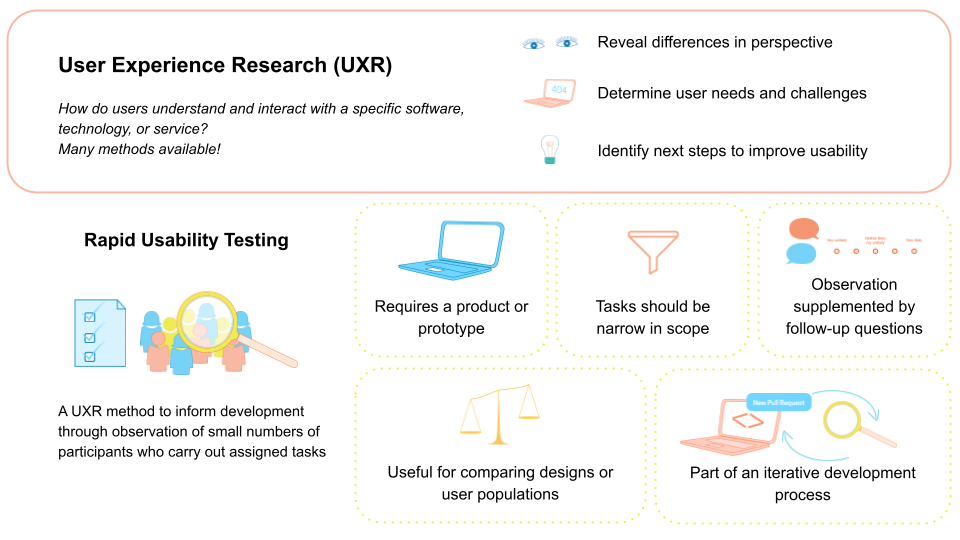
User experience research (UXR) is the investigation of how people interact with, make sense of, and respond to technology and services. Often, your goal with UXR will be to improve the usability of your product, making it easier to adopt and use.
Usability is made up of other attributes that determine how easy to use a technology or service is. Nielsen Norman Group, a respected authority on usability and user research, identifies several characteristics of usability (lightly adapted here):
- Learnability: How easy is it for users to accomplish basic tasks the first time they encounter the design?
- Efficiency: Once users have learned the design, how quickly can they perform tasks?
- Memorability: When users return to the design after a period of not using it, how easily can they reestablish proficiency?
- Errors: How many errors do users make, how severe are these errors, and how easily can they recover from the errors?
- User satisfaction: How pleasant is it to use the design? How positive or negative are users’ feelings about the tool?
- Utility: Does it do what users need? Does it enable users to accomplish their goals?
Exercise 1: One form of UXR-Rapid Usability Testing
In the skit you’ll watch, a study facilitator guides a participant through a rapid usability test. For the purposes of this tutorial, you have the view a participant would. This means you can see the participant’s screen when the facilitator would (as they complete a task) and times when the facilitator would not be able to see their screen (as they reply to a survey).
After the skit is over, we’ll discuss the skit as a group: What was interesting to you? What was confusing? What aspects of usability do you think this study could address?
There are many methods to study user experiences. You could do interviews, observation, participatory design, A/B testing, surveys, contextual inquiry, card sorting, or one of many more options.
Rapid usability testing is a kind of user research experience that focuses on how a small number of users interact with a specific software, technology, or service—it evaluates the experience. Rapid usability testing is meant to help you make decisions about how to design your tool and user experience. It’s not academic level rigor, it’s meant to be quick and good enough to make informed decisions.
In a testing session a researcher will ask a participant to perform a series of tasks or respond to a set of prepared prompts related to the tool being tested. Tasks should be well scoped; this makes them quick to accomplish and results easier to interpret. The researcher will observe the participant’s behavior, may ask them to ‘think aloud’ as they perform the task, and will ask follow-up questions when necessary. Only 3-10 participants are needed, fewer if you include any interview questions as a follow up to your tasks. Five is a norm for sample size in usability testing.
You may wish to use rapid usability testing in order to compare user populations or design options. For example, “Do people prefer X or Y design?” You might find sometimes that neither design option is good but, especially if you have follow-up interview questions, you can learn why and can still integrate some improvement into the code quickly.
Because usability tests are used to assess some interface and offer insights, this means that you must have something for users to work with during the test. That could be a tool or service already available for use. Alternatively, you can create an interactive prototype using tools designed for this purpose, such as Balsamiq or Figma. Or, maybe you have a paper prototype people interact with. Whatever you have does not have to be final or perfect, but you need something for users to interact with.
Exercise 2: When should rapid usability testing be used?
For each of the scenarios below, consider if the person in each scenario should start rapid usability testing next. Indicate your decision using the Zoom poll and jot down some notes on why you chose your answer.
Scenarios:
- Rae is going to develop a gold standard dataset of journal article submissions, tagged with their venues, peer review outcomes, and reasons for acceptance or rejection. Rae will develop a tool that assesses draft articles for their probability of successful publication.
- Chung previously made their software package PHANCY accessible via downloads on their personal website; users could install the downloaded files. Chung recently made PHANCY installable with the pip package management system. He’s gotten a bunch of emails from users having trouble with pip though.
- Sam wrote a script that helps their two labmates automate some common tasks. Sam was thinking the script might be more useful if it also logged in a shared spreadsheet when it was executed and by whom.
This is a bit subjective but it comes down to whether or not you have something for people to work with, people to talk to, and something you want to learn about. Rae is probably too early in development given they don’t seem to have any kind of tool for users to work with. Chung seems like they would benefit from usability testing. Sam might have too few people for any kind of quantitative evaluation but talking to the labmates would likely be useful.
Callout
Rapid Usability Testing is one of many approaches in UXR. There are a variety of methods which may be better suited for different scenarios, circumstances, and/or phases in the product lifecycle. For example, user discovery sessions may be a good fit for when a general concept is known but an associated tool or service does not yet exist (more on the discovery phase here; and affinity diagramming is an approach that is particularly well-suited for the qualitative analysis of user feedback with smaller sample sizes. This guide from 18F, the former GSA digital services team, helps lay out the many options available to you.
Key Points
- Usability refers to how easy it is to use a technology or service.
- User experience research is the investigation of how people interact with, make sense of, and respond to technology and services.
- UXR improves scientific software products by revealing differences between software developers’ and users’ perspectives and assumptions. UXR can also surface insights that can simplify tool use and adoption and help determine user needs amid a rapidly changing technological landscape.
- UXR can measure a product’s learnability, efficiency, memorability, errors, or utility and user’s satisfaction.
- Rapid usability tests are tools for observing how users interact with a tool or service. Tests should involve narrowly scoped tasks and measurable outcomes. Results from these tests are used to guide development work.
- Rapid usability tests are most effective for teams that already have an interactive prototype, a minimum viable product, or more mature tool or service
Content from Preparing a rapid usability test
Last updated on 2025-07-25 | Edit this page
Overview
Questions
- What makes a good task for rapid usability testing?
- What metrics are typically used in rapid usability testing?
- How do I structure a participant’s session?
- What should I say to my participants?
- What is pilot testing?
Objectives
- Articulate task prompts for rapid usability test
- Determine metrics for addressing your research question
- Develop a usability test script
- Prepare a usability test environment
- Describe the benefits and risks of a pilot study
Defining tasks for rapid usability testing
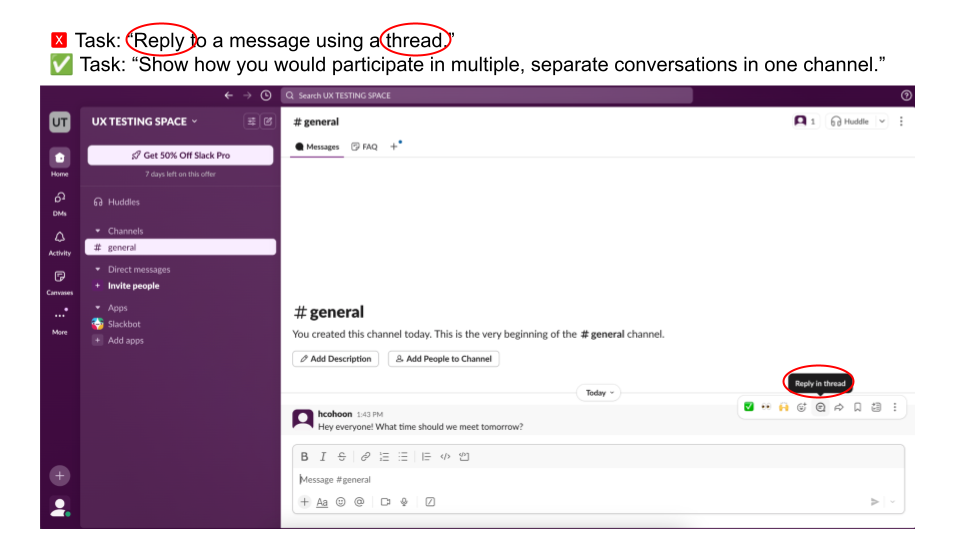
A task should be something that users actually want to do that can be accomplished in a short period of time. When defining tasks for your rapid usability test, keep in mind that you usually don’t want to test users’ reading comprehension—you want to test the usability of the interface. Thus, avoid using terms visible in the interface in your task description. Nielsen Norman has additional advice on how to craft good task prompts.
Example: Being goal oriented and avoiding language from the user interface
After you’ve selected tasks for your usability study, time yourself completing study tasks to establish a baseline. To prevent fatigue, you want to aim for your session to be under 30 minutes. Allowing 10 minutes for non-task activities like instructions and interview questions means you should have no more than 20 minutes for task completion. Reduce the number or complexity of tasks you have planned if needed.
Selecting your evaluation criteria
To answer your research questions, you need metrics. Determine what these will be before you start collecting data. The number and choice of metrics will be a judgment call only you and your team can make. Metrics might be countable and observable things like seconds or minutes, number of clicks, or number of errors. Metrics could also be gathered via a survey question that uses a scale, such as confidence on a scale (1, not at all confident – 5, completely confident) or level of agreement that the tool has the needed functionality (1, strongly disagree – 5, strongly agree).
Exercise 3: Evaluating ease
Assume you wanted to know how easy it is for Slack users to send threaded replies. You will assign users the task, “Show how you would participate in multiple, separate conversations in one channel.”
In the Zoom poll, choose two metrics from below that you could use in your study.
| Metric |
|---|
| Successes: Number of participants who successfully complete a task. |
| Errors: Number of mistakes made while attempting a task, possibly broken down by error type. |
| Clicks: Number of clicks participants make when completing a task; a proxy for complexity or efficiency. |
| Completion time: Time taken to complete a task. |
| Idle time: Periods of inactivity during a task, indicating confusion or hesitation. |
| Drop-off rate: Percentage of participants who stop a task before completing it. |
| Self-reported ease: Participants’ rating of how easy or difficult a task was to complete. |
| Self-reported satisfaction: Participants’ rating of how satisfied they are with the interface or experience. |
| Self-reported usefulness: Participants’ rating of how useful the tool or service is. |
Successes, errors, and self-reported ease are fairly natural choices here but the choice of metrics is up to you and depends on what you want to know about. Some metrics like clicks or idle time might be easier to collect with specialized software but a screen recording can get you pretty far.
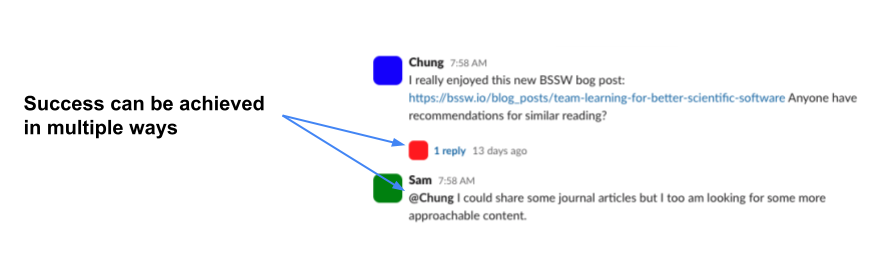
Because you are likely evaluating success or counting errors, you should define what success looks like. Just like there are multiple ways to make errors, there may be multiple ways of achieving success.
Developing a script
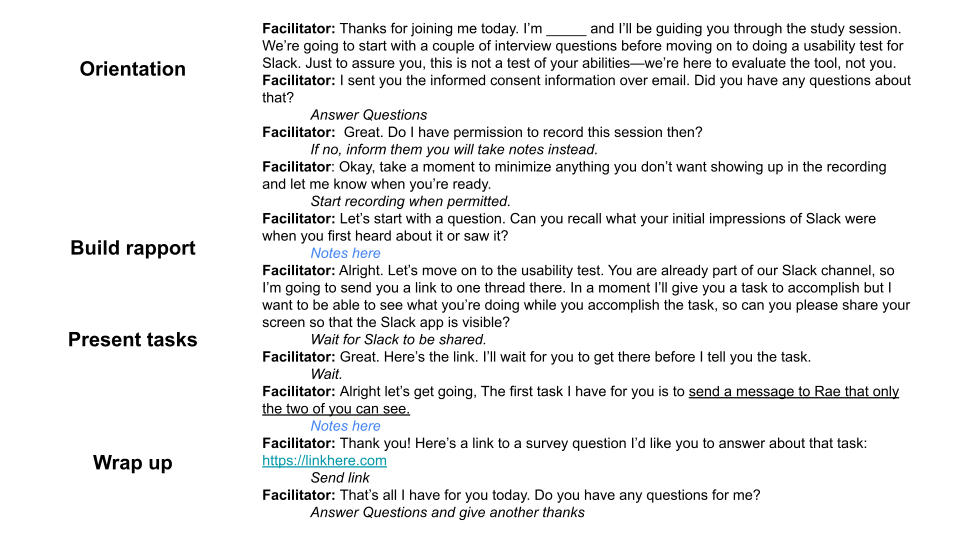
It is important that you give each of your participants the same experience when they join your study, so that results are comparable across participants. You want to avoid giving hints or causing confusion. You also want participants to feel comfortable talking with you. Following a script and prepping the test environment will make sure you succeed in these goals. The script should cover everything you’ll say to a participant so that someone else can stand in for you and still run the exact same study.
Example: Asking survey questions with anonymous IDs
Often, when verbally asked a question that uses a Likert style scale (e.g., “On a scale of one to five, how easy was this task for you?”), participants will hesitate to provide a number and might give a more expansive answer. We recommend sending self-report questions like this as survey questions instead of asking them out loud. Google Forms are a simple way to do this.

After you have prepared your script, ask someone to help you pilot (i.e., test out) your study. Ideally you would do this pilot with someone who would make a good participant, but that benefit should be balanced against the need to include eligible people in your actual study. Run the pilot session exactly as you would a real session and keep track of any needed changes to your script; it’s very important that the tasks themselves are easily understood. This is also an opportunity to ensure the study takes an appropriate amount of time. Run multiple pilots if needed.
Key Points
- Rapid usability testing should involve observing participants for no more than an hour, preferably less than 30 minutes. Choose the number of tasks you ask participants to complete based on your priorities and how much time you have available.
- Task prompts should be goals users might have and should not use language visible in your user interface.
- Evaluation criteria should be determined in advance. Multiple criteria can be used to evaluate a single concept like ease of use.
- Without specialized software, capturing some data like clicks or idle time may be difficult. However, many other common metrics are relatively simple to evaluate if you can record a session and/or present survey questions. If you are evaluating a command line tool, you may ask participants to copy their terminal contents and email them to you at the end of the session.
- When asking participants survey questions, do not do so verbally. Make sure you have a way of associating their anonymous response with their recorded session; anonymous participant IDs are a good choice.
- Preparing a script and the test environment ensures you run the same test with each participant and helps make sure you gather all the data you meant to.
- Your test sessions should begin with some orientation and rapport
building, then move on to the tasks before wrapping up.
- During orientation, introduce yourself and outline what will happen during the study. Reassure participants that they are not being tested—only the tool is being evaluated.
- When building rapport, ask the participant a question about themselves that they can confidently answer.
- When presenting the tasks, try to order them so that your most prioritized tasks go first, ensuring you get to them. If there is a logical sequence to them, you might apply that structure instead.
- In your script, include links to any appropriate webpages or survey questions so you can easily share this information with participants; put them next to the appropriate task, not at the top of the page.
- You will need to link any anonymous survey responses to their study session. A simple way is to assign each participant an ID number and tell them this ID number before sending them the survey; they can then enter that into the survey.
- Piloting your study helps ensure you have accurate estimates of how long a session will take, helps refine your script and environment set-up, and can inspire additional questions or tasks to include. However, if you anticipate difficulty recruiting, you should limit your piloting so that you don’t practice with too many potential actual participants.
Content from Recruiting and tracking participants
Last updated on 2025-07-25 | Edit this page
Overview
Questions
- Who should I be recruiting?
- How many people should I recruit?
- How do I find users that I don’t have a connection with already?
- What is snowball sampling?
- What ethical considerations should I have when doing user experience research and how does that work with my scientific research?
- How can I keep track of (potential) participants and their data?
Objectives
- Define a value proposition for the tool to be studied
- Define a target study population for user experience research
- Craft a recruitment email
- Identify ethical considerations that must be accounted for when conducting human subjects research
- Leverage snowball sampling and broader advertising to increase recruitment
- Recruit participants who have never used your tool
- Track participation in a protected spreadsheet
- Establish a participant list for future testing
Who to recruit
When deciding who to recruit for your study, consider who your tool is meant to support, in what settings, and how. Sometimes this is called a value proposition—it’s a statement of benefits. By considering what benefits you offer and to whom, you can identify the general type of person you should be recruiting for your study because this is also your target user audience.
Your research question can also be helpful when determining who to recruit as it may include some prerequisite requirements.
Example: Defining a target population
Based on your research question and value proposition, you can identify the general type of person and specific requirements for your target population.
| Research Question | Value Prop | Target Study Population |
|---|---|---|
| When Slack users return to the design after a period of not using it, how quickly can they add a channel? | Via synced phone, browser, and desktop applications, Slack revolutionizes team communication by enabling seamless collaboration and enhanced productivity in a dynamic work environment. |
Requirements: - Slack users who have not opened the app in XX days General type of person: - Use Slack for work with a team |
How many to recruit
Once you know what type of person you want to talk to, you’ll next need to decide how many users you’d like to have in your study. There are no wrong answers here; what is important is that you feel comfortable with the data you’ve gathered and can use that data to make informed design decisions. If you are seeking statistical significance, you will need to recruit many more participants than you would otherwise. However, because rapid usability testing is easily applied in an iterative development process and because you don’t need very many participants to gain insights, we recommend testing with up to 10 people.
While usability studies outside of scientific software usually offer an incentive for participation, such as a gift card, this is often not needed for scientific software. Scientists and researchers often genuinely want to see improvements in the tools they rely on for their work and to help their fellow researchers; a sense of community and shared interest is generally a sufficient motivator. Additionally, they often appreciate helping to shape the software’s future direction. Thus, while an incentive like a gift card is nice, it is not necessary.
When recruiting, most strangers you reach out to will say no. If you are recruiting from people you are regularly in contact with, you can expect higher and more positive response rates.
How to recruit
Unless your study is time bound in some way, recruitment can happen in phases.
We recommend direct, individualized emails to recruit participants for your study if possible. This approach means that you have a record of when and who you reached out to and personalized requests can be more effective than broad canvassing with flyers or posts to forums. If you have or can find contact information for your users or eligible participants, leverage it to send these emails.
A common risk participants in user studies face is a breach of confidentiality, meaning their opinions or data get shared with unexpected people in a way that compromises their anonymity. With rapid usability testing, most of the study will involve participants engaging with your tool in routine ways, so no unusual risk should be added. However, you might be asking some interview questions or participants might volunteer information they wish to keep private. Be sure to state how you will handle participants’ data: Will you anonymize it? Who will have access to the data? Will you keep any identifiable information? Will you ever publish the data? Providing this information is important for ensuring participants can make informed decisions about participation.
Exercise 4: Evaluating an Example Recruitment Email
Recruitment emails should:
- Address an individual
- Introduce the sender and research team
- Summarize the goal of your study
- Explain what you want from the participant and why them
- State the time commitment (based on a pilot study or a best guess)
- Explain any eligibility requirements; Ask or link to necessary screener questions
- State any risks participants might be subject to and how you will mitigate them
- Explain how you will handle their data
- Make clear that participation is voluntary
- State any incentive you have to offer
- Clearly ask for their participation
Review the example recruitment email below and check off the recommended content you see using the Zoom poll.
Hi _______,
I am a researcher working with PHANCY and am conducting user studies to improve our installation process. I understand you are a PHANCY user and hoped we could learn from your experience. Might you have thirty minutes some time in the next couple of weeks to participate in one of these user studies?
During the study session, I would observe you doing some typical tasks using PHANCY, focusing on how you install updates to the package. I’d record and transcribe the session but only I would have access to those raw files—the broader PHANCY team would only be shown anonymized content so that you can be completely open during the interview. Once I’ve finished anonymization I will delete the raw files completely and retain only anonymous data in our private cloud storage. We’ll only use your data to guide our internal decision making; this isn’t for publication. Participation is completely voluntary.
If you’re able to participate, please share a day and time that would work well for you.
Thanks for your consideration!
best wishes,
The email could be improved in a number of ways (e.g., be less formal in tone) but only eligibility requirements and incentive info are missing. What you include will depend on who you are emailing and your study design.
Sometimes recruitment emails can get lengthy and that can be overwhelming, reducing your response rates. You might want to move some details below your email signature or into an informed consent document to keep the request simple and clear. Depending on your institution and your goal for your research (i.e. to create generalizable knowledge or to inform only your own decision making), you may have an Institutional Review Board (IRB) that will have additional information and regulations you should heed when planning, executing, and recruiting for your study. If you have intentions to share, present, or publish data, reach out to your IRB for guidance.
When scheduling participants, remember to give yourself some buffer time and end the test promptly at the time limit to respect the participant’s time. Don’t schedule test sessions back to back - give your team a break between sessions.
Expanding your recruitment efforts
Recruitment is often the most difficult part of any study with human participants. You might find that emails are not effective enough and you need to find more people. You may also be trying to recruit people who have never used your tool and that can be a surprisingly difficult type of person to reach.
Snowball sampling is one approach to increasing your advertising efforts. Snowball sampling is when a potential participant refers the researcher to additional potential participants. This is great for recruitment but can introduce bias and must be done with care to protect participants’ privacy.
Exercise 5: Snowball sampling
In the Zoom poll, identify which recruitment tactics are examples of snowball sampling:
- Asking someone who did not agree to participate if they know anyone else who might be willing
- Inviting people who have submitted bug reports
- Posting to a community forum
- A participant introduces you to another possible participant
- Adding a link to sign up for your study to your software’s README
- Identifying potential participants by seeing who has cited your software
“Asking someone who did not agree to participate if they know anyone else who might be willing” and “A participant introduces you to another possible participant” are snowball sampling. All others are good recruitment mechanisms but not snowball sampling, which requires a referral.
Tracking participation
You’ll need a central place where you can keep track of who you have recruited and when/if they will be participating. Create a spreadsheet for this. It can be especially useful to also include when people were contacted and followed up with as well as links to session transcripts or recordings and notes. See the image below or follow this link to a template participant tracker that you can make a copy of and use yourself.

In your participant tracker, assign participants anonymous IDs like Participant 1 or P1 so that you can identify them and their data without using their name. The private tracker should be the only location where you link anonymous IDs to identifiable information. If you don’t have to record identifiable information, don’t. You likely don’t need things like age, gender, or race and it is possible you don’t even need participant names or contact information.
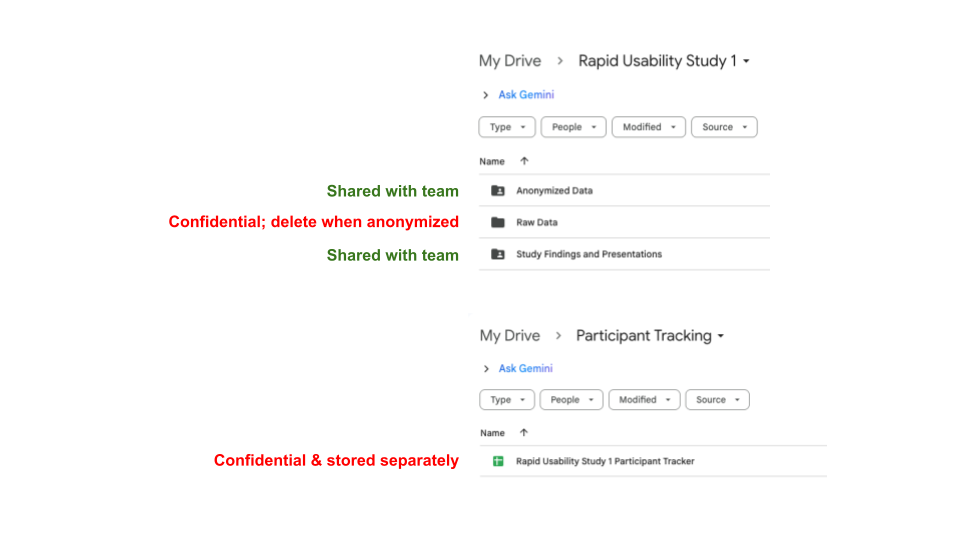
Including links in that tracker to notes and recordings means you are associating private information with identifying information like the participant’s name or email. That makes it very important that this be a confidential, private document accessible only to the people that participants agreed to. Make sure to save it in an appropriate location, preferably somewhere password protected. We recommend keeping a private folder for this tracker and any raw (non-anonymized) data. If you were using cloud storage like Google Drive for your study, you might use a folder structure like this:
To make the most of your recruitment efforts and facilitate future studies, you can keep a separate list of people who consent to be contacted about additional user research opportunities. Ask at the end of a study session or via email if it’s okay to reach out again in future. When you do contact those people again, explain that they previously consented to this and ensure they know they can ask to be removed from your list. Keep this list, your participant pool, in a separate location from study data and do not record anything in the list about which research people have engaged in or how they came to be included in the list. It should be private so that only people directly involved in study recruitment have access. You can enable people to join this list by creating and sharing a sign up form.
Key Points
- Identify your targeted population for your user study by considering the constraints that your research question implies and your tool’s value proposition. Some constraints might be true prerequisites for participation while others might be nice-to-haves that can be forgone if recruitment is difficult.
- Recruitment targets can be reached through iteration; about 10 people should be sufficient to gain insights.
- Recruitment should be done conscientiously so that participants understand what they are being asked, what their data is being used for, and how it is being stored. Conducting human subjects research ethically also involves ensuring there are appropriate benefits for participation, that participants are treated with respect, and that you never coerce them.
- Snowball sampling is when a potential participant refers the researcher to additional potential participants. This is great for recruitment but can introduce bias and must be done with care to protect participants’ privacy. Posting to community forums, leveraging your code repository, and identifying then contacting users based on software citations are other tactics you can use to find participants.
- Recruitment should be tracked in a private location.
- Recruitment efforts for one study can support future studies—ask participants if they are willing to be contacted about future user research opportunities.
Content from Conducting a rapid usability test
Last updated on 2025-07-25 | Edit this page
Overview
Questions
- What final set up is needed?
- How do I find out what a participant is thinking while doing their assigned task?
- How can I maximize insights from my small study population?
Objectives
- Prompt participants to think-aloud
- Assist participants with error recovery
- Avoid giving users hints while they are completing a task
Ensuring smooth data collection
Having determined your tasks and written a script for your study sessions, prepared your participant tracker, and recruited participants, most of your work is already done!
Before each study session, send a reminder to your participants and, if appropriate, include the link to the video conferencing tool you will be using (e.g. the link to the Zoom room). In your participant tracker, mark down that you sent the reminder.
Before the session begins, make a unique copy of your script and include the anonymous ID you’ve assigned to the session participant in the title. Have this copy open so you can read along and take notes. We recommend making your notes another color like blue so you can easily distinguish what you should say aloud from your notes. Link to this copy in your tracker.
During the session, participants will need to share their screen. Encourage them to only share the needed application (e.g. a browser window if the product being evaluated is online) and when sending survey questions, tell the participant they can open the survey in a different browser window so that they have privacy when responding. Make sure these suggestions are included in your study script so you don’t forget to say them.
With small studies, getting more qualitative data (i.e. non-numerical data) can help ensure you gather rich insights and don’t rely too heavily on interpreting trends from small sample sizes. To gather this data, when orienting your participants, tell them you would like them to think-aloud while they work on tasks. This is somewhat unnatural and might slow participants down—if you are using time as a metric, you might reconsider this approach. However, if you want to get more information on participants’ impressions, it can be quite helpful. You might use prompts like, “What are you thinking?” or “Tell me what’s going through your head,” if they need reminding to think aloud.
Sometimes participants might quit a task without finishing it or may get quite lost while attempting to carry out the task. Assure them that this is okay and you are learning a lot from them. It is very important to not give any hints—you won’t be there to do that for real users. Have links and any needed information on hand to send to participants so that when they begin a new task, they can do so regardless of how successfully they carried out the previous task.
It is tempting to want to fill gaps in conversation. However, intentional silence can be a powerful technique for moderation and learning more from participants. Try to hold silences past your comfort point so that your participant fills the space and not you. Wait with a relaxed manner. If your participant asks a question, try offering a noncommittal, “Hmmm,” or, if this is during a follow up interview, you can encourage them to go on by saying, “Tell me more about that.”
Include multiple researchers
If you are a part of a team with the capacity for more than one person to help with rapid usability testing, it can be helpful to plan for different roles and responsibilities during a session. For example, you might have a moderator verbally facilitate the session, a notetaker make and record real-time observations, and a tech role to manage recording, pasting in the meeting chat, and any other troubleshooting. Allowing for multiple roles–especially if a recording is not possible–can help each individual stay more focused and present in their role.
Exercise 6: Thinking aloud
In breakout rooms, you and a partner will act as study facilitator and participant in a rapid usability test. To save time, in this scenario, we will skip some other portions of orienting participants and the usual warm up questions.
Choose your roles, have the participant share a browser window in Zoom, then have the facilitator read the script aloud and the participant engage in the assigned task. The facilitator can take notes in the place of their choice. Swap roles if you have time. We’ll discuss the exercise as a group when you’re done.
SCRIPT
Facilitator: “While you work, please think-aloud as much as you can. That just means narrating out loud what you are doing, what you’re looking for, what you’re thinking. That will help me understand your thought process. If you fall silent for a little while, I’ll remind you to think-aloud. Otherwise I’m going to stay as quiet as possible until we reach the interview portion. Any questions?”
Facilitator: “Ok. This is a link to the US-RSE website.” Send link via chat: https://us-rse.org/
Facilitator: “Your first task is to go there and find information on how you could receive a financial award from US-RSE to support your work. Let me know when you’ve found the information.” Remind participants to think-aloud if they fall silent too long while working. Take notes.
After the session is over, store the recording into a private folder for raw data. Zoom will produce a transcript but services like Dovetail and Otter.ai also provide helpful audio transcription and sync the recording to the transcript itself. Review the transcript and anonymize it, removing names and identifiable information. Keep in mind that specific details about research projects can be very identifying. The Qualitative Data Repository has useful information on how to anonymize transcripts, as does this article from the UK Data Service. Save this anonymized version in a separate folder from the raw data. Link in your tracking spreadsheet to the anonymized version.
It is also recommended to go through the recording on your own to note when there are long pauses or where a user’s mouse was hovering when they were looking for a particular feature. This non-verbal information can be helpful in understanding your user’s mindset and assumptions.
Your institution may have an IRB that has additional guidance or policies on anonymization or data retention. If you are collecting data in the EU or European Economic Area or are otherwise subject to the General Data Protection Regulation (GDPR), note that after anonymization, you should remove any records that would allow you to re-identify data (e.g., identifying info in your participant tracker). UCSF has helpful information on understanding GDPR policies.
Key Points
- To protect their privacy, participants sharing their screen should be able to share only what is needed for the study.
- Having participants think-aloud is a good way to learn more about their reactions and opinions. It can slow them down, however, so reconsider this approach if you are using time as an evaluation metric.
- Ensure errors from one task don’t propagate to the next by sending participants new links at the start of each task.
- As you collect data, anonymize it and link to that data in your tracking spreadsheet.
Content from Analyzing data and reporting results
Last updated on 2025-07-25 | Edit this page
Overview
Questions
- How do I get insight into the kinds of errors my users make or encounter?
- How do I calculate metrics like error rates?
- What is reverse scoring?
- How do I interpret think-aloud data?
- What should I tell people about my study?
- What is an actionable insight?
Objectives
- Label qualitative data
- Calculate usability metrics
- Present results so that they highlight actionable insights
- Respond to UX skeptics
Start by labeling the qualitative data
To learn from your participants’ behavior and think-alouds, you will need to review and label your raw qualitative data. This is sometimes referred to as coding your data and is a key step in many qualitative analysis methods. You can use open coding to apply labels inductively, coming up with new ones as you proceed. Or, you can work with a coding scheme, a set of predetermined labels that are relevant to your research question. This is an iterative process—label your data as soon after you’ve collected it as possible and return to and revise those labels after you have collected more data.
The labels you assign are going to represent your data later, so if you want to be able to talk about what activity people were engaged in while encountering system errors or what people’s emotions seemed to be while completing a task, make sure you code for those things.
Tools like Dovetail, Atlas.ti, or Taguette may be used to support this process, but you can do it without specialized software. The main thing you need is a way to associate labels for things you care about with pieces of data like quotes or mouse and click locations. You want to be able to explore labels assigned to data and, conversely, data assigned to labels. Excel spreadsheets can accomplish this.
Example: A coded think-aloud
In this example, the coding scheme includes: task, emotional state, and memory issues.
| PID | Quote | Task | Emotional State | Memory Issue |
|---|---|---|---|---|
| P1 | Alright, I’m just entering the command. ‘pip install PHANCY’ and I hit enter. | pip install | neutral | NA |
| P1 | I’m pretty sure there’s a way you can specify the specific version but I can’t recall. | pip install | neutral | yes |
| P1 | I’m watching it make progress now. Yeah, look at all that. | pip install | positive | NA |
| P1 | And it’s done! It’s telling me it was successful so that’s it. | pip install | positive | NA |
Categorizing errors
If you are interested in errors, you may use error categories as part of your coding scheme. Common error types include: - Failed attempts: Entering invalid data, such as incorrect login credentials or formatting errors. - Misnavigation: Navigating to unintended pages or sections. - Repeated actions: Attempting the same action multiple times unsuccessfully. - Incomplete tasks: Abandoning a task or failing to achieve the intended goal. - System errors: Triggering error messages or encountering broken functionality.
You could also assign a severity to errors. A severity scale you could use is: - Critical: Prevents users from completing a task (e.g., broken functionality or unclear instructions). - Moderate: Slows users down or causes frustration but doesn’t prevent task completion. - Minor: Small mistakes with minimal impact on task completion.
Example: A coded error
What counts as errors are up to you; we recommend adopting a user’s perspective though. If they think there’s a problem, document that somehow.
Here, a participant thinks there is an error because they haven’t seen any changes. The facilitator running the session might know that the tool is working but because the user thinks there was a problem, the error was labeled with two codes—Error: moderate and Error: no status update. These describe the type and severity.
| PID | Quote | Task | Error |
|---|---|---|---|
| P2 | I hit enter but nothing is happening. I think it’s broken. | pip install | Moderate; no status update |
Exercise 7: Applying labels
The quote below is a fictional participant thinking aloud while trying to reserve some nodes for their analysis work; they’re describing filling out a form.
“I’m just filling in my information in the form. I need two GPUs so I’ll enter that here. Okay, I’m….I’m just reviewing to make sure things are correct. Alright, we’re good. I can hit submit. Oh. Wait. I guess I forgot something. Oh just checking that box. Okay now we’re good.”
Read the quote a couple of times and then, in the Zoom poll, list some labels you might apply to the quote if you were studying how easy it is for users to make those reservations. Labels can be a single word or short phrases. Separate labels with commas (,) or slashes ().
There aren’t really wrong answers here as you’ll apply the labels that you think represent the data well. You might describe each step they take. You might label the error types or their severity. You can use colons or dashes to create labels with subtypes as well, e.g. “task: reserve nodes.”
Memoing
When reporting results, you will need to give your audience explanations—why did participants make these errors? What were they doing when they abandoned a task? Why were people feeling a given emotion? You can rely on your labeled data to answer these kinds of questions. Look at all the quotes associated with labels you deem most important and try to find patterns in them. Write short memos that summarize what you are seeing and which point to strong examples or exceptions.
Evaluating metrics
The formulas for calculating many of the common usability metrics are shown below. Generally, you will want to evaluate each task individually because that is how you will gain the most actionable insights.
| Metric | Formula |
|---|---|
| Successes: Number of participants who successfully complete a task. Also commonly reported as a rate. |
Total, calculated for each task: number of successes Rate, calculated for each task: (number of successful attempts / total task attempts) * 100 |
| Errors: Number of mistakes made while attempting a task, possibly broken down by error type. Also commonly reported as a rate. When categorized, proportions may be reported. |
Total, calculated for each task: number of mistakes identified Rate, calculated for each task: (number of mistakes identified / total task attempts) * 100 Proportion of one error type: (number of mistakes of X type / number of errors of all types) * 100 |
| Clicks: Number of clicks participants make when completing a task; a proxy for complexity or efficiency. |
Total, calculated for each task: number of clicks |
| Completion time: Time taken to complete a task. |
Calculated for each task in seconds: time at task completion - time at task start - any time spent on extraneous things |
| Idle time: Periods of inactivity during a task, indicating confusion or hesitation. |
Calculated for each task in seconds: time at idle end - time at idle start |
| Drop-off rate: Percentage of participants who stop a task before completing it. |
Rate, calculated for each task: (number of people who do not complete a task / total task participants) * 100 |
| Self-reported ease: Participants’ rating of how easy or difficult a task was to complete (e.g., using a Likert scale). |
Calculated for each survey item or combined items: sum of ratings / total task participants |
| Self-reported satisfaction: Participants’ rating of how satisfied they are with the interface or experience. |
Calculated for each survey item or combined items: sum of ratings / total task participants |
| Self-reported usefulness: Participants’ rating of how useful the tool or service is. |
Calculated for each survey item or combined items: sum of ratings / total task participants |
Because your sample sizes will likely be small, you should capture the range for any averages, meaning you will state the lowest and highest scores. And, when reporting rates, you should also include totals.
Typically, when using self-report measures, a higher rating would indicate a more positive response. For example, when using a scale of 1-5, a score of 5 on a question asking how useful a tool is would indicate a highly useful tool. If you use any self-report measures that are negatively phrased, such that a higher score means something bad, you need to reverse score that item. To reverse score, subtract the rating from the highest score possible plus one. Reverse scoring should occur before calculating combined metrics.
Reporting results
When presenting results from your study, give your audience context so they can form their own judgements. Tell them what the goal of your research was, what you did, and who you did it with. Make it easy for your audience to understand exactly what the data you are showing them represents.
How you plan on delivering results will affect the depth of context you need to share. Will you be delivering a write-up or report? Will you present your findings in real-time? Will you be sharing your slides with them afterward? You may need to include more details if your audience will be reviewing the results asynchronously, without you being there to explain and answer questions.
Exercise 8: Which is clearer?
In the Zoom poll, respond to questions about how easy to interpret each of the following options are.
Option 1
Error rate: 87.5%
Minor errors: 71.4%
Average ease: 4
Average confidence: 3.8
Option 2
87.5% attempts to install included an error, most (71.4%) of which were minor.
Average ease on a 1-5 scale: 4
Average confidence on a 1-5 scale: 3.8
Option 3
87.5% attempts to install included an error, most (71.4%) of which were minor.
Overall, the task was ______ to complete. (1 very easy - 5 very difficult)
average ease: 4
range: 3-5
How much do you agree with the following statement: I felt very confident using the system. (1 strongly disagree - 5 strongly agree)
average confidence: 3.8
range: 3-5
Option 3 should be clearest. Different formatting might help.
Your audience will want an explanation of the behavior behind the metrics. Help them understand what participants were thinking and doing. You can leverage the memos you have written about emergent patterns and important examples and you may wish to again review the labeled data that’s relevant to your research questions. This way you can report on things like what participants were doing when they encountered critical errors.
In addition to quantitative results and qualitative explanations, you should report some actionable insights based on your findings. This is how your rapid usability test can inform development work. An actionable insight describes what the insight is (e.g. users’ expectation or a common problem) and an achievable step you should take next.
There may be many possible next steps you can see but you can prioritize them by considering:
- If the issue negatively impacts your value proposition
- The severity of the issue based on how many people it affects and to what degree
- Whether or not your team is able to address the issue in the near future
When reporting actionable insights, don’t hedge, say exactly what should be done next, e.g. redesign a feature, update documentation, conduct additional interviews. GitLab’s Handbook on UX research has useful suggestions about how to craft actionable insights.
You may encounter a team member who is skeptical about whether or not they should act on the results of your study. Generally, an effective response is to compare to the alternative: you know more now than you did before the study and you can move forward based on more than gut instinct. Acknowledge that your sample size may be small, but this is the norm in UX work and continued engagement with users can help you gauge how representative your results are. And, just like the software code itself, the user experience and your understanding of it is iteratively improved. That’s why we do rapid usability testing—it fits in with agile work cycles.
Key Points
- Apply a coding scheme to label qualitative data like transcripts. Iteratively review the data and labels you have applied so that you represent the data as best you can. You can combine labels together or make new ones that better represent your data.
- Specialized tools are helpful for labeling and exploring qualitative data but spreadsheets or printed transcripts and post it notes can do the job too. Whatever your system, you want to be able to explore labels assigned to data and, conversely, data assigned to labels.
- Errors can be labeled by severity or type, allowing you to more easily recognize which issues are the highest priority.
- Evaluate and report on tasks individually so that you have finer grained insight into users’ experiences. Multiple metrics can help inform your interpretation of how usable the tool is.
- When reporting results, tell your audience what the goal of your research was, what you did, and who you did it with.
- When presenting data, ensure the audience can understand exactly what metrics mean and provide information like ranges, medians, and modes to assist with interpretation.
- Leverage the labeled data to help you report trends in what participants were doing, thinking, and feeling throughout their tasks.
- An actionable insight describes what the insight is (e.g. uses’ expectation or a common problem) and an achievable, concrete step you should take next. These should be included in your reporting.
- Rapid usability testing can be integrated into your development process so that you continuously improve your understanding of your tool’s UX.